


Key Takeaways
Child Traffic Safety in America (2019-2023)
Between 2019 and 2023, nearly 11,000 children were killed in motor vehicle collisions in the United States. This is approximately 6 deaths a day. This represents an annual rate of 3.36 child traffic deaths per 100,000 residents under the age of 18.
Teens represent the largest portion of such deaths, accounting for 61% of all deaths of persons under the age of 18. School-age children aged 5 to 12 represented nearly 24% of deaths, while children 4 years old and younger accounted for 15%.
Nearly one in six children killed during this period was a non-occupant (pedestrian, bicyclist, or on another personal conveyance).
Montana had the highest child traffic death rate in the U.S., with a yearly rate of 7.48 per 100,000 children. This rate is more than double the national average.
Six of the ten states with the highest child traffic death rates are in the U.S. South. This includes: Mississippi, Alabama, Arkansas, South Carolina, Louisiana, and Oklahoma.
Wyoming had the highest rate of unrestrained child fatalities, with 3.54 deaths per 100,000 children.
Hawaii consistently showed low child traffic death rates and totals across overall fatalities, unrestrained fatalities, and fatalities involving teen drivers.
Data analysis based on NHTSA fatal crash data (2019-2023)
Every day, families buckle their children into cars expecting to reach their destination safely. Yet for many, an ordinary trip can turn into a tragedy. Motor vehicle collisions are the leading cause of unintentional death among U.S. children.
Despite decades of overall decline in crash fatalities, unintentional motor vehicle traffic deaths have risen by 12% in the U.S. over the last five years (2019 to 2023), according to Center for Disease and Disease Control and Prevention (CDC) data. This figure is even higher for children aged 17 and younger — an 18% increase that reverses steady progress in child traffic safety dating back to the 1990s.
At Anderson Blanda & Saltzman, our Lafayette personal injury attorneys believe that nearly every traffic death is a preventable tragedy; an outcome that is especially unacceptable when the person killed is a child. To inform safety efforts, we analyzed the latest five years of fatal crash data from the National Highway Traffic Safety Administration (NHTSA) to identify when, where, and why children are killed in traffic collisions.
For the purpose of this study, we define children as any person under the age of 18.
Read on to uncover our findings.
Jump Links
- Child Traffic Fatalities by Age Group
- Child Traffic Fatalities by Person Type
- What U.S. States Lead in Child and Teen Traffic Deaths?
- Unrestrained Motor Vehicle Occupant Child Fatalities
- Unrestrained Child Traffic Fatalities by State
- Teen Driver Fatalities by State
- Protecting Children on the Road
Child Traffic Fatalities by Age Group
Between 2019 and 2023, 10,936 children died from motor vehicle crashes in the United States. This equates to nearly 6 children killed every single day.
Since children face different seating requirements based on their age, this overall figure is broken down by age group to better understand associated risks. The age groups are as follows: young children (ages four and under), school-aged children (ages five to 12), and teenagers (ages 13 to 17).
The majority of child traffic deaths are teenagers, who account for over 60% of all fatalities among those under 18. This is largely because teenagers have greater exposure to the road, both as new drivers and as passengers in peer-driven vehicles, where restraint use is their responsibility. They are also more likely to commute independently by walking, cycling, or riding skateboards, scooters, and other personal conveyances, often without full awareness of traffic risks.
The next largest group comprises children aged four to 12 years old, with approximately 24% of fatalities. School-aged children may ride in motor vehicles more often than their younger counterparts. They remain vulnerable because their safety depends on adults to secure them properly and to instill the habit of buckling up. This age group may also face risks while playing on neighborhood roads.
The remaining 15% of fatalities involve children 4 years old and younger. While the lowest proportion among the age groups, it is significant because it highlights the tragedy of very young children losing their lives while being entirely dependent on adults for their safety on the road.
Below is a more detailed breakdown of child traffic deaths by individual age across the U.S.
Children under 12 years old represent the smallest share of fatalities, with each age accounting for about 3% or less. Starting at age 13, the percentage of fatalities begins to rise, increasing from under 5% at age 13 to over 6% at age 14. After age 15, the increase becomes much sharper, peaking at nearly 24% by age 17.
Child Traffic Fatalities by Person Type
Children involved in fatal crashes occupy different roles, from passengers inside vehicles to pedestrians or riders of bicycles and other personal conveyances. Below, we break down the proportions between motor vehicle occupants and non-occupants.
Most child fatalities occur among motor vehicle occupants, who account for about 83% of all deaths, while approximately 17% represent non-occupants.
Below is a more detailed breakdown of non-occupant child traffic deaths by person type across the U.S.
Pedestrians make up the largest group of non-occupant child fatalities, accounting for nearly 7 of every 10 deaths. These deaths often involve children walking near roads or crossing streets, highlighting the importance of safe pedestrian infrastructure and supervision, especially within environments like school campuses.
Cyclists account for over 20% of non-occupant child fatalities, while children riding personal conveyances such as skateboards or scooters make up 6.78% of deaths. These figures exemplify the risks associated with independent travel outside vehicles. The remaining fatalities involve children in non-motor vehicle transport devices (2.15%).
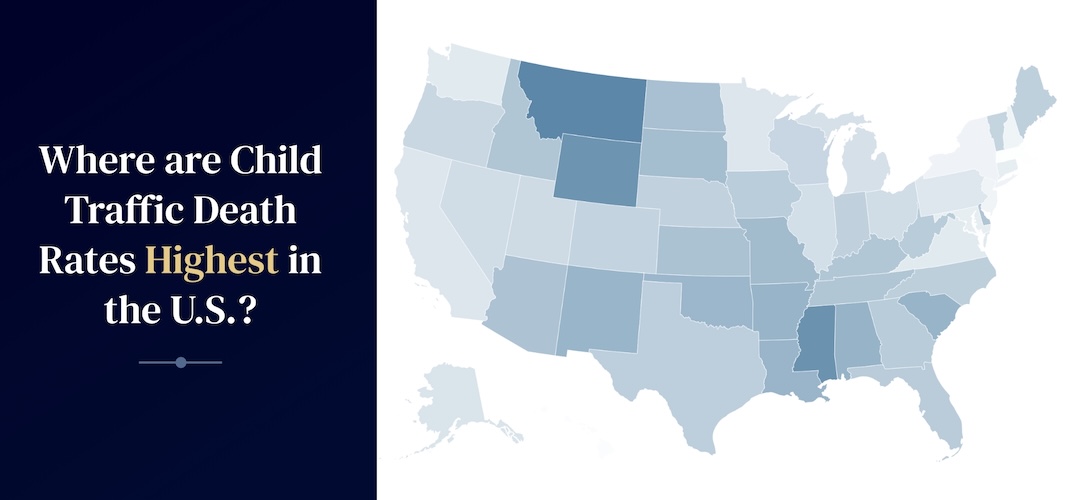
What U.S. States Lead in Child and Teen Traffic Deaths?
Child traffic safety looks very different from state to state. This map shows the average yearly rate of child traffic fatalities per 100,000 children, based on five years of crash data.
For another view of the same data, the table below ranks states by average yearly child traffic fatality rate and includes totals with an age-group breakdown. Both motor vehicle occupants and non-occupants are represented in these figures.
Montana has the highest average yearly child fatality rate in the nation, with 7.48 deaths per 100,000 children.
This is more than twice the rate seen in populous states like Texas and California. More children were killed in Texas than in any other state, with 1,314 child traffic deaths during the observation period. This is nearly 40% more than the next highest state, California, with 914.
While total fatalities differ widely due to population differences, normalized rates provide a clearer and more equitable understanding of child traffic risks across states.
Mississippi and Wyoming follow closely behind, each with rates exceeding 6 deaths per 100,000 children. These high rates are concentrated mostly in rural and less populous states, particularly across the South and West regions. States such as Mississippi, Alabama, Arkansas, South Carolina, Louisiana, and Oklahoma consistently rank among the highest..
In sharp contrast, the lowest child fatality rates are found in Northeastern and coastal states like Rhode Island, Massachusetts, and Hawaii, where rates fall below 1 death per 100,000 children. Hawaii’s low fatality rate aligns with its nationally leading seat belt usage rate of 98.4% in 2023, as reported by NHTSA, supporting strong evidence that higher restraint use is associated with reduced child traffic fatalities. Other Northeastern states with low rates, including New Jersey, New York, and Connecticut, suggest that higher urban density and more developed traffic infrastructure may also contribute to safer outcomes for children.
Importantly, analysis of fatalities by age reveals that teenagers consistently represent the most vulnerable group across all states. This finding stresses an urgent need for targeted safety initiatives aimed at this age group.
Unrestrained Motor Vehicle Occupant Child Fatalities
Perhaps the single most important thing parents can do is ensure that their children wear seatbelts or are properly restrained in car seats.
During the observation period, unrestrained children were killed at a highly disproportionate rate.
In fact, despite an observed seatbelt usage rate of over 90% in the US, nearly half of all children killed in traffic collisions were unrestrained.
By age group, the data show that restraint nonuse was more common among older victims. Among the youngest victims (under age 5), about one-third of fatalities involved unrestrained occupants. That figure rises to 41.46% for children ages 5 to 12 and peaks at 54.81% among teenagers ages 13 to 17. This may suggest that as children move from car seats and booster seats to greater independence, the likelihood of riding without restraints increases significantly.
Unrestrained Child Traffic Fatalities by State
With overall rates established, the next table focuses on unrestrained fatalities, showing how states differ in the rate, count, and share of children killed without protection. Each state’s seat belt law is included alongside these figures for context. For full details on seat belt and child restraint laws, see the Insurance Institute for Highway Safety (IIHS) or consult each state’s official resources for the most up-to-date and complete information.
Many of the states with the highest overall child fatality rates, such as Wyoming, Montana, and Mississippi, also show the highest rates of unrestrained child fatalities. This connection shows that failing to use proper restraints is a key factor contributing to child deaths on the road in these regions.
This elevated risk in Wyoming, Montana, and Mississippi likely stems from a combination of factors common in largely rural states. These include higher-speed rural roads and longer emergency response times. Cultural factors in these areas also contribute to lower child restraint use, alongside socio-economic challenges like limited access to healthcare, which together increase the severity and fatality of crashes.
Analyzing both the rates and proportions of unrestrained child fatalities identifies critical areas where the lack of restraint use is especially acute. States such as South Dakota and Colorado not only show high overall rates of child traffic fatalities but also report that over 60% of these fatalities involved unrestrained children. These dual indicators highlight where improper restraint use is a significant contributing factor and where targeted intervention could have the greatest impact. Meanwhile, states such as Mississippi and Indiana, with similar fatality rates but lower unrestrained proportions near 40%, illustrate the varied behavioral and enforcement challenges across the country.
Seat belt laws differ across states. In many states, the enforcement level, either primary or secondary, depends on the occupant’s age and seating position. Primary enforcement allows police to pull over vehicles solely for a seat belt violation, while secondary enforcement requires another traffic violation first. Traffic safety groups agree that a strong child passenger safety law includes primary enforcement for children up to 16, along with other recommendations regarding restraint systems, caregiver responsibilities, and more.
However, seat belt law classifications alone do not fully explain fatality rate disparities. Although many states with primary enforcement laws appear among those with high unrestrained fatality rates, law type is an imperfect proxy for actual compliance or enforcement rigor. Other factors, including public education, law enforcement intensity, socio-economic status, and cultural attitudes, also critically influence restraint use and related fatalities.
These findings should be interpreted with the understanding that the dataset reflects only fatal crashes, representing the most severe outcomes. Non-fatal injury crashes and general restraint-use compliance in all crashes may show different patterns. Therefore, while this data highlights critical safety gaps, it is not a comprehensive measure of overall child passenger restraint behavior or safety.
Teen Driver Fatalities by State
The next section examines crashes involving teen drivers aged 16 and 17. The table below shows, for each state, the proportion of all traffic fatalities that involved a teen driver, the total number of fatalities in those crashes regardless of occupant age, and the total number of teen driver fatalities.
Teen drivers face elevated risks on the road due to inexperience, a tendency toward high-risk behaviors like speeding or distraction, and the challenges of navigating complex traffic conditions.
In Idaho, teen drivers were involved in 5.53% of the state’s traffic fatalities, the highest proportion among all states. These crashes resulted in 66 deaths, including 21 teen drivers. Closely behind, Iowa and Montana each had more than 5% of their traffic fatalities involving teen drivers. Iowa recorded 95 fatalities in crashes involving teen drivers, 35 of whom were the teen drivers themselves, while Montana had 55 such fatalities, including 31 teen drivers.
On the low end, California stands out: although the state has a large number of fatalities involving teen drivers, these account for just under 2% of all traffic deaths. Of the 401 fatalities involving teen drivers, 128 were the teen drivers themselves. Among all states, Hawaii had the lowest share (1.62%) and total number (8) of fatalities involving teen drivers. It also recorded the fewest teen driver fatalities, with 3.
Overall, our analysis indicates s that states with higher proportions of teen driver involvement tend to be more rural or have significant rural populations, echoing patterns seen in earlier sections regarding rural risks. Rural teens may face longer travel distances, higher speeds, and less access to driver education programs or robust enforcement, increasing their vulnerability on the roads.
Protecting Children on the Road
While the data reveals troubling trends, there is also a path toward prevention. Restraint use remains one of the most effective ways to protect children in a crash. Nationally, seat belt use reached 91.9% in 2023, as estimated by NHTSA’s National Occupant Protection Use Survey (NOPUS). This marks a 0.3% increase from 2022 and a 1.8% rise since 2016. While encouraging, this still means millions of drivers and passengers travel unrestrained each day, and for children, that choice can be deadly.
Public safety campaigns, such as Click It or Ticket and Child Passenger Safety Week, work to raise awareness about proper restraint use and safe driving habits. While strict seat belt and child seat laws are important, enforcement alone does not guarantee compliance, which makes these outreach efforts critical. Seat belts remain just one factor in crash outcomes, but they are a controllable one. Reducing child and teen fatalities requires drivers to remain vigilant, patient, and attentive at all times. Roads and city planners need to design safer streets that account for young passengers and drivers, including traffic calming measures, clear signage, and dedicated pedestrian and bike infrastructure. Vehicle manufacturers also play a role by continuing to improve safety features, from advanced restraint systems to crash avoidance technology. Together, informed drivers, effective public policy, thoughtful infrastructure, and continued safety innovations can help reduce the toll of motor vehicle crashes on children and teens.
Methodology
We analyzed FARS data from 2019 to 2023, focusing on individuals under 18 years old who sustained fatal injuries in a motor vehicle collision. Rates were calculated using 2023 population totals for residents under 18 from the U.S. Census.
Fair Use Statement
If you believe this study could be useful to others, please feel free to share it. We kindly request that any citations or references include a link to the original study allowing readers to review the complete methodology and findings.